You Know Money Is Owed Across 30 Projects. Can You Tell Me How Much, Right Now?
WFP shows every dollar coming in, going out, and sitting uncollected on one screen. Without a two-hour collections meeting.
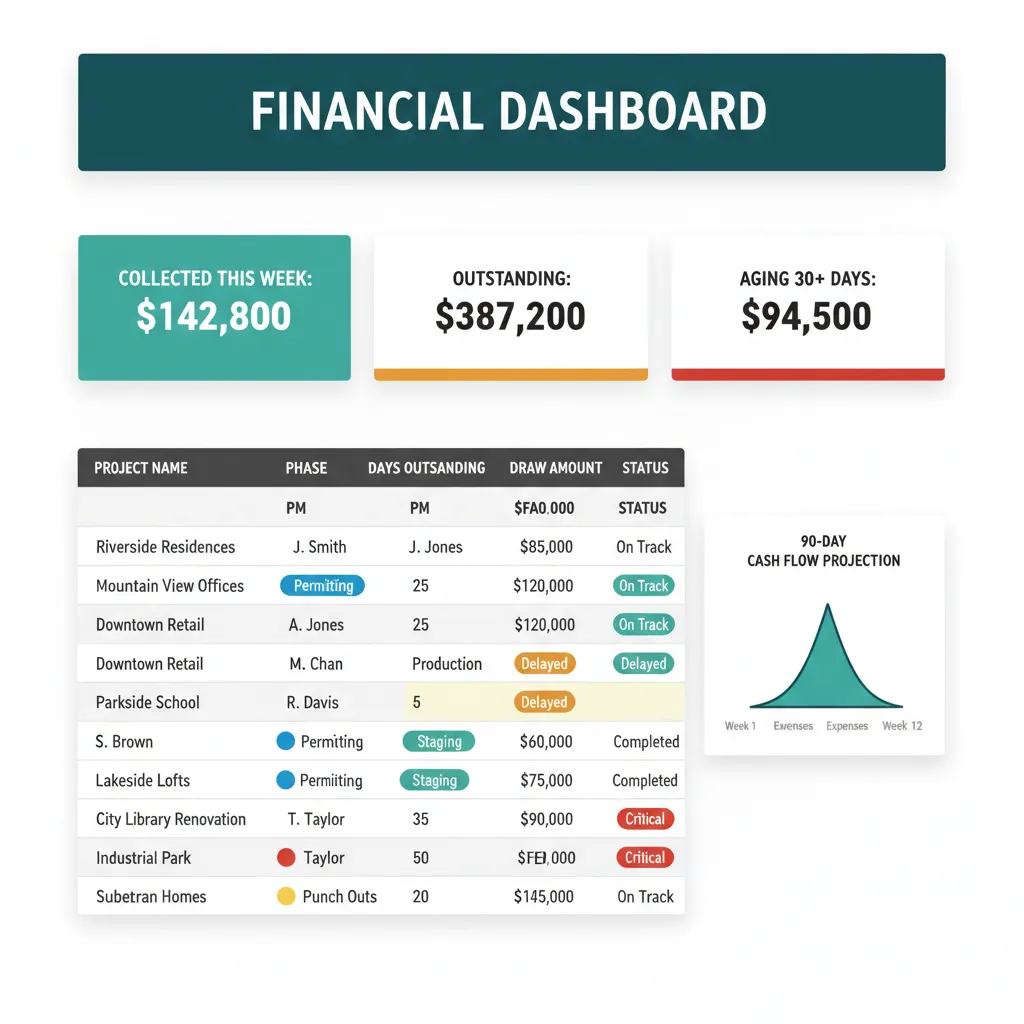
Your Collections Meeting Takes Two Hours. Nobody Brings the Numbers.
The collections meeting is on the calendar. Your PMs walk in with three different versions of the AR aging report. One PM thinks the Garcia draw was issued last week. Another swears it is still pending the staging inspection. Finance pulls up QuickBooks. PMs pull up texts. Two hours later, the meeting ends with everyone agreeing to "circle back." Construction cash flow management software is supposed to prevent this scene, and the spreadsheet you have been running is not it.
Pool draws are tied to phase progression: deposit at signing, then dig, gunite, plaster, decking, and final. When a project sits in Production for 17 days because the gunite crew is behind, the draw waits with it. But nothing in the current setup tells you that. You see a calendar. You do not see the dollars locked in that calendar.
When the only person who knows your weekly cash position is you, and you only know it after you ask three people, you are funding someone else pool with your line of credit.
Cash flow surprises are not a math problem. They are a visibility problem.
Five Financial Views. One Dashboard.
WFP gives you five financial views that fit how construction money actually moves: profitability per project, AR and collections, draw scheduling, cash flow projection, and a gamified collections dashboard your PMs can compete on. Every view updates in real time.
Financial Analysis Tab
Per-project profit, costs, and margin tracked live as the job moves through phases. See which project types make money and which leak it. The view catches the pool you priced six months ago that is now underwater on materials. Construction financial management software is only useful when the margin number updates the same day the material invoice lands.
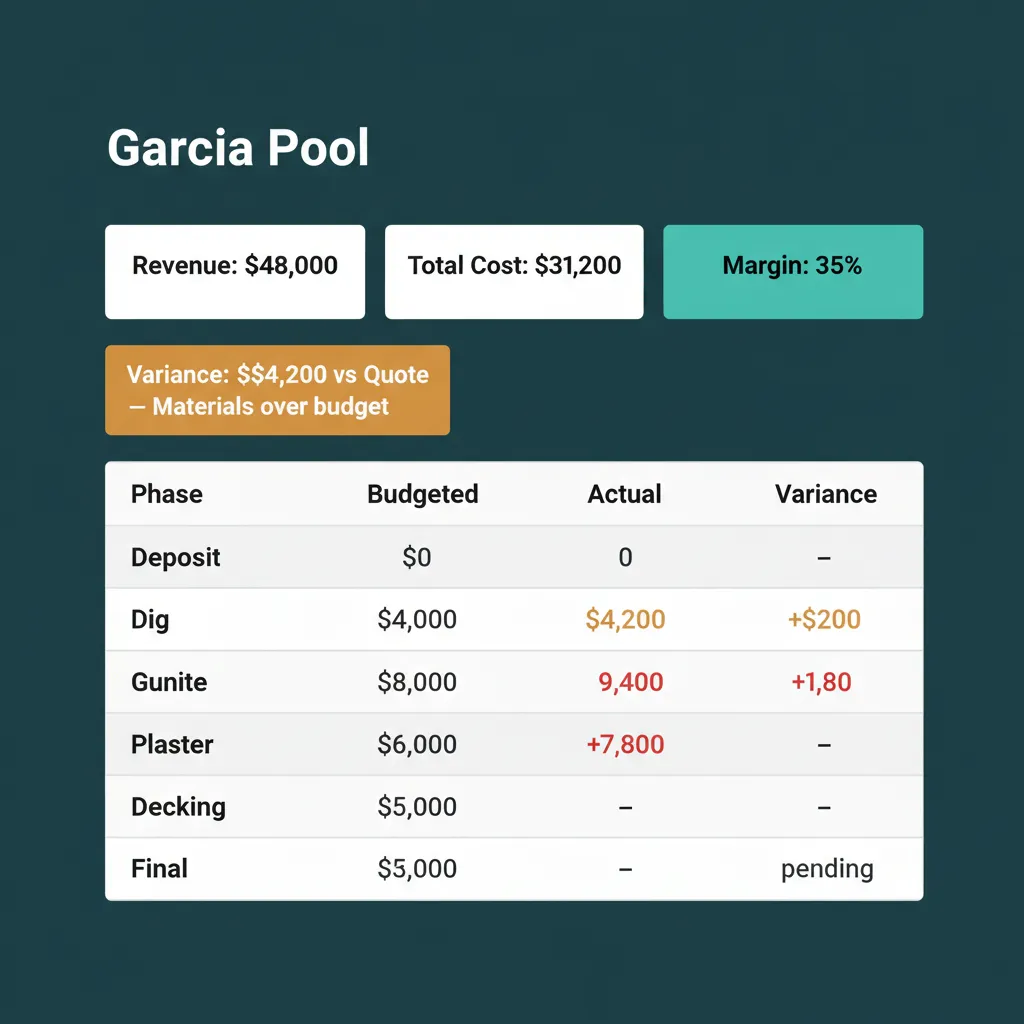
The pool that is underwater. You see it the day it goes underwater.
AR and Collections Dashboard
Every dollar owed, by project, by phase, by PM. Filter by overdue, by aging bucket, by draw stage. The number you could not get in your Monday meeting is the first thing you see Monday morning. Construction AR collections dashboard built around how draws actually flow on a job.
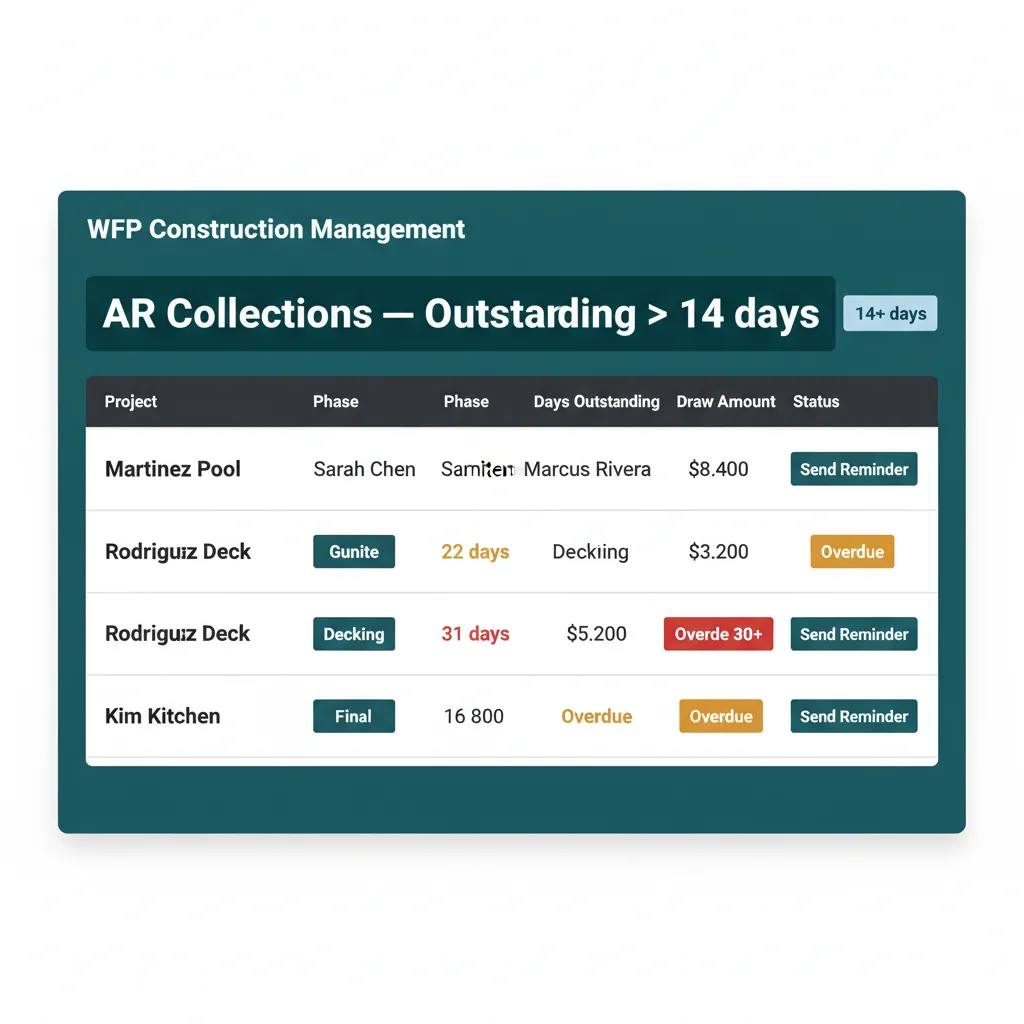
Every overdue dollar, ranked by how late it is.
Draw Scheduling Tied to Phases
Deposit, dig, gunite, plaster, decking, final. Every draw is tied to a phase trigger. When the phase advances, the draw is queued automatically. Pool-specific draws fit how pool builds actually work, but draw management construction owners run on roofing, outdoor kitchens, and remodels is configurable for any phase-based project type.
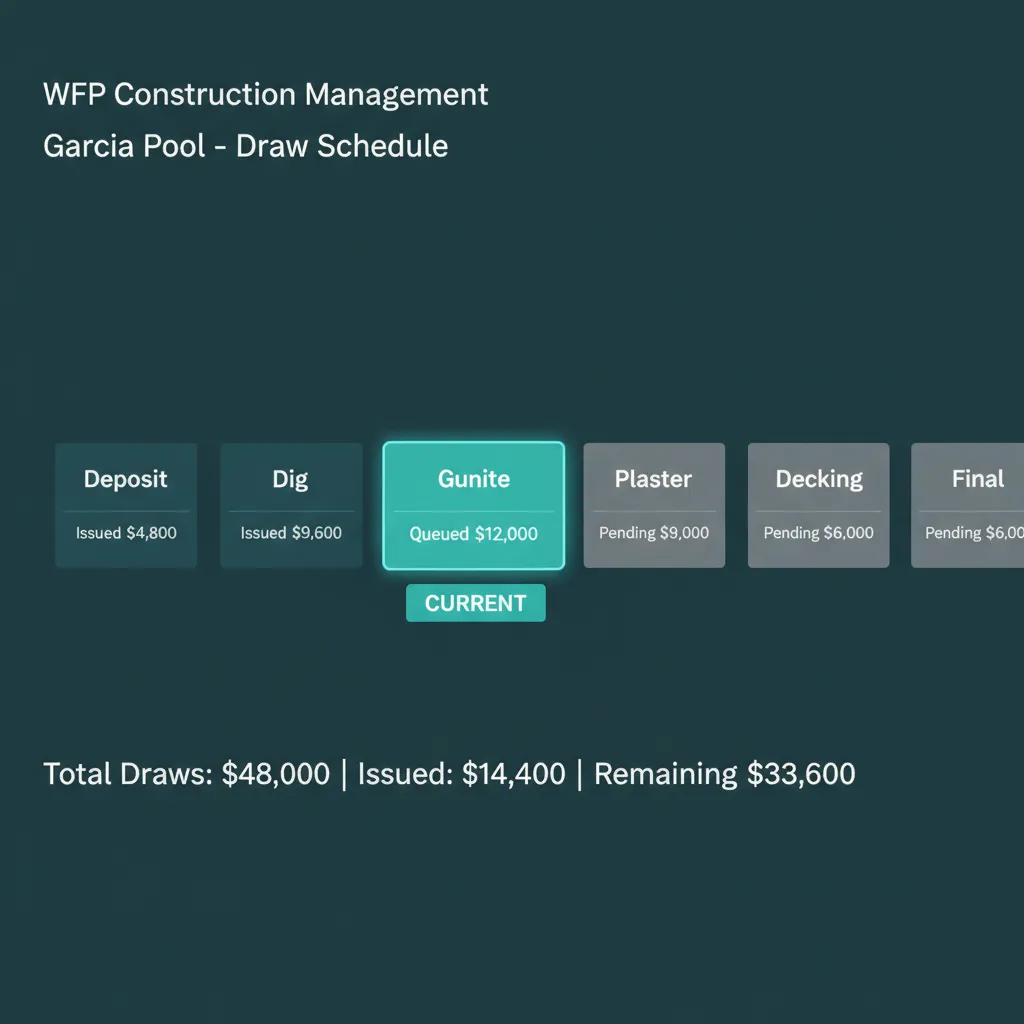
The phase advances. The next draw is already queued.
Cash Flow Projections
A 30, 60, and 90-day forward view that accounts for committed draws, expected costs, and phase timing. You see the cash trough before it hits, not after. Forecast is not a separate spreadsheet, it is a live view of the projects already on your dashboard.
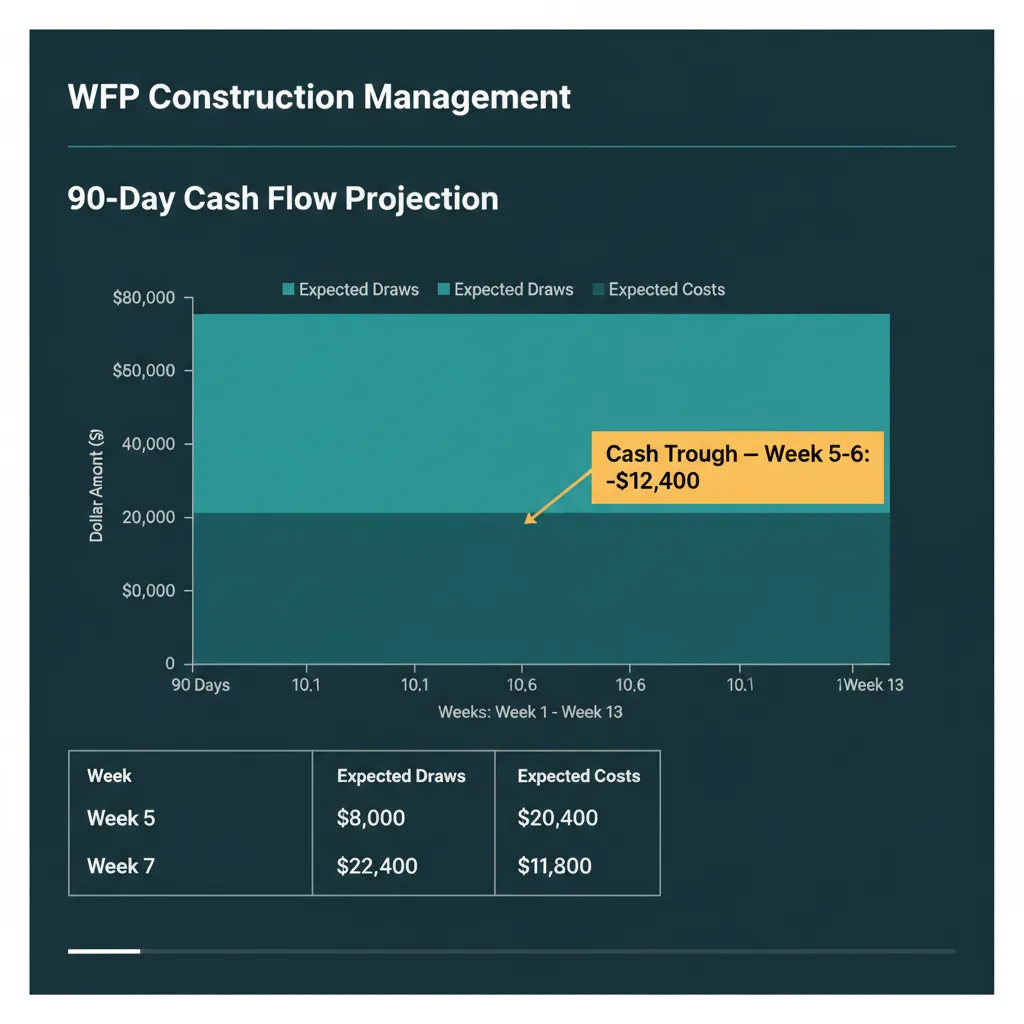
The trough before it hits. With time to act.
Gamified Collections Dashboard
PMs commit to a weekly collection target on Monday. Collected vs. collectible updates live. The team sees the leaderboard. Friday percentage is visible to the whole company. Collection becomes a team sport instead of an afterthought, and the engagement layer is what generic job costing software for contractors leaves on the table.
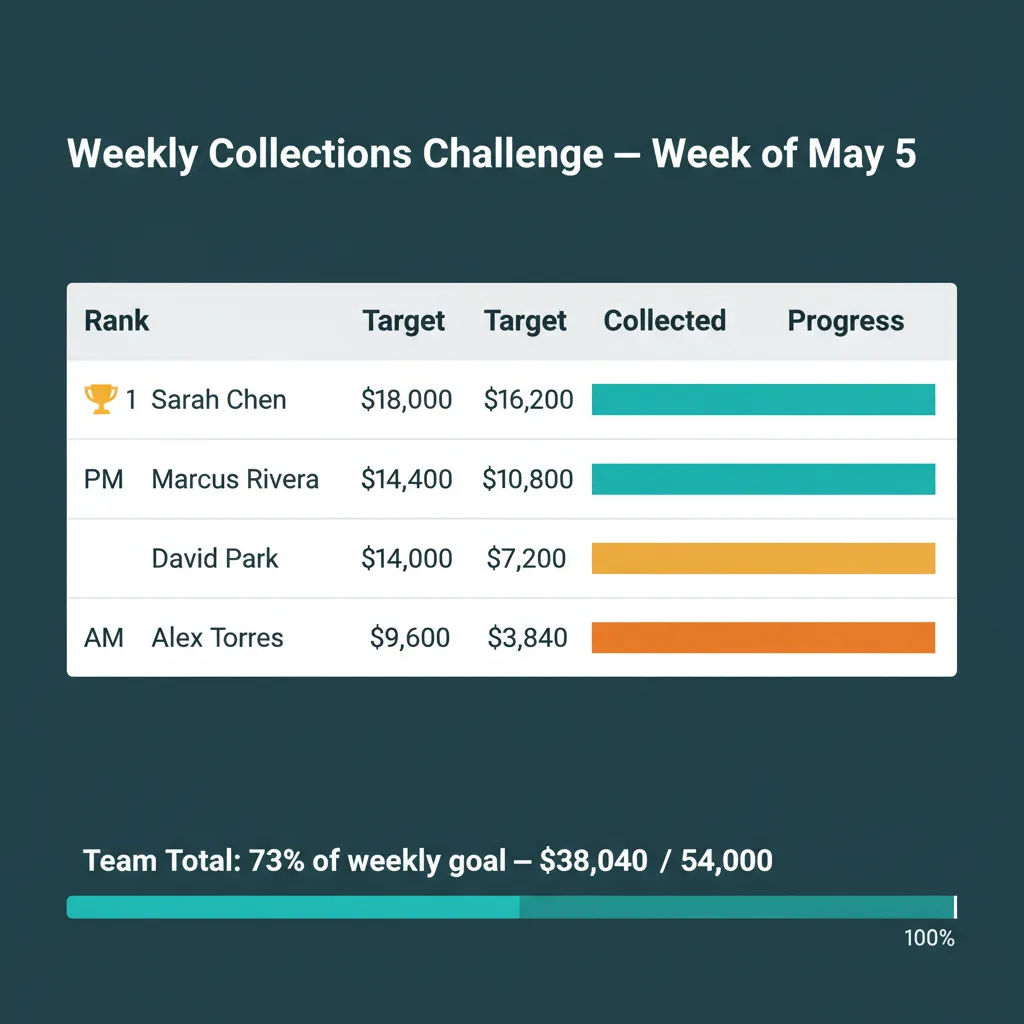
PMs commit Monday. Friday percentage is on the wall.
WHAT GENERIC PM TOOLS CAN'T DO
Most Tools Track Invoices. WFP Makes Collections a Team Sport.
Generic PM tools have invoicing. They have financial reporting modules. They have cost tracking. None of them turn AR into something a PM is accountable for in front of the rest of the team. WFP does. Weekly targets, real-time progress, full team visibility.
Most platforms separate the schedule from the money. WFP does not. Phase-tied draws mean every project financial state is in lockstep with its operational state. Stalled in Staging means a draw is also stuck in Staging, and the cash flow projection updates in real time to reflect that.
Why we built this
Built around the way construction money actually moves. Not retrofitted from a generic accounting bolt-on.
BATTLE-TESTED
When the company that built WFP rolled out the financial dashboard, operational overhead dropped roughly thirty percent inside a year. Production meetings shortened. Collections accelerated. The line of credit started earning interest instead of paying it.
Common Questions About Financial Management
WFP handles project-level financial tracking, profitability, draws, AR, and cash flow projections inside the platform. Most builders keep QuickBooks for accounting and tax. WFP gives you the operational financial view QuickBooks was never built for.
PMs commit to a weekly target on Monday. The dashboard tracks collected vs. collectible in real time. The whole team sees the leaderboard. Friday percentage tells you who hit and who missed. Collections becomes a competition, not a chore.
Yes. Every project shows live profit, costs, margin, and variance against the original quote. Filter the all-projects view by profitability to find the leaks before they hit your year-end.
Draws are tied to phases, deposit, dig, gunite, plaster, decking, final. When a phase advances, the next draw is queued. The system is configurable for any phase-based project type, not just pools.
Yes. The cash flow projection view accounts for committed draws, expected costs, and phase timing. You see the trough before it hits, with enough notice to act.
WFP is one flat platform fee with unlimited users, no per-seat billing. One avoided cash flow surprise, one missed draw, one runaway material order, recovers more than a month of platform cost. The pricing page covers how it is scoped to your operation.
See Financial Management in Action.
Bring your last week AR aging. We will show you the same data on one screen, with the next draw queued and the cash flow projection running.
Schedule a DemoNo 6-month onboarding commitment. No per-seat pricing. Just a conversation about how your operation could run.