End of Month. You Need to Know Which Projects Are Profitable. The Number Comes Tomorrow. Maybe.
WFP reporting is a live dashboard across financial, project, sales, and employee activity. The numbers are there when you ask, not when someone gets around to compiling them.
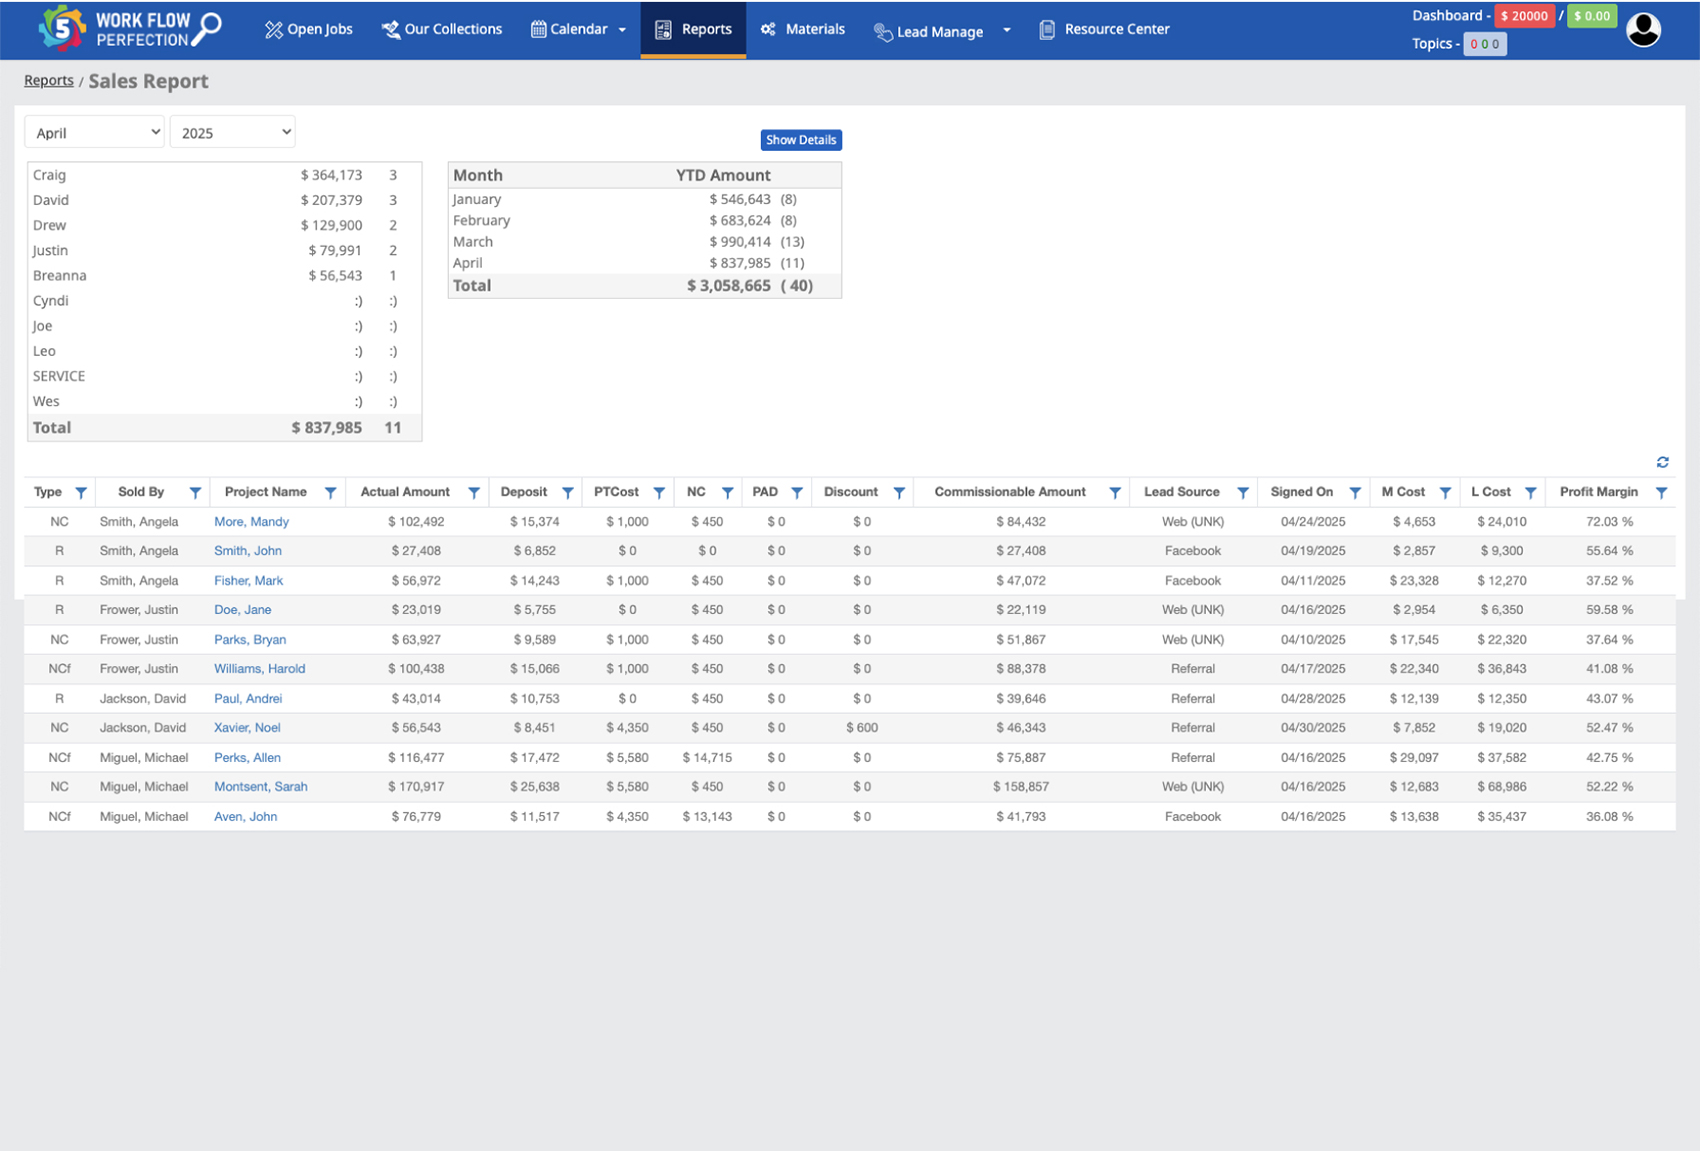
Your Reports Are CSVs Pretending to Be Insight.
End of month. You need to know which projects are profitable, which PMs are behind schedule, where cash is sitting uncollected, which sales sources are actually converting. Your current tools give you four CSVs and a junior bookkeeper rebuilding the same Excel pivot table she rebuilt last month. The numbers come on Tuesday. The decisions you needed them for happened on Monday.
Construction reporting software is supposed to answer questions, not generate data dumps. But most platforms treat reporting as an export feature. The data is there, the report is not. You spend the back half of every month reconstructing a picture of your business in Excel because the platform that holds the data does not know how to show it to you.
If a question takes more than 60 seconds to answer, your reporting is broken.
Live Dashboards Across Every Dimension
The WFP reporting suite covers financial, project, sales, and employee activity in one place. Every report is a dashboard, not an export. Every number is filterable across project type, PM, phase, time range, sales source, and customer.
Financial Reports
Profitability per project, costs per project, AR aging, draw schedule status, cash flow projections by week. The owner answers where is the cash without opening a spreadsheet. Construction project reports stop being a deliverable and become a live view.
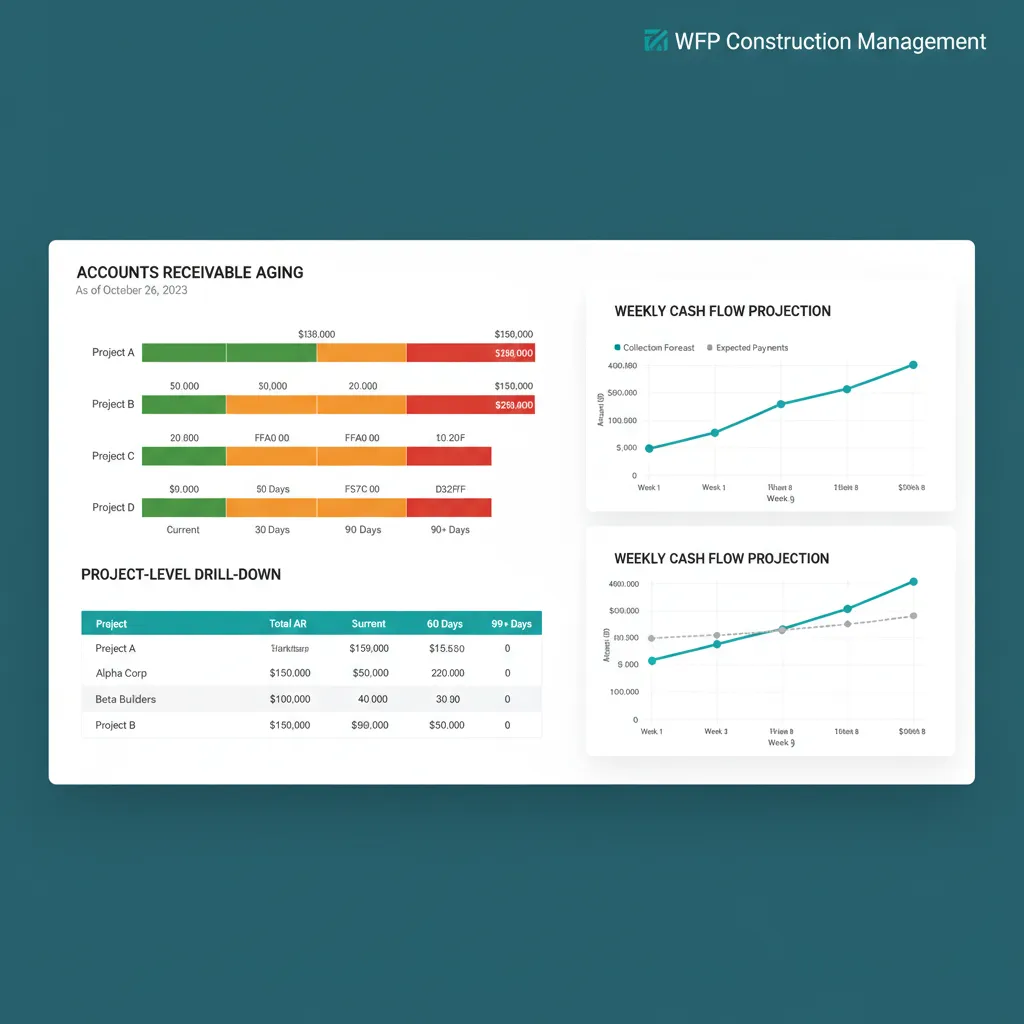
AR aging, draw status, weekly collection forecast. The owner reads the numbers, not Excel.
Project Reports
Active projects by phase, in-phase duration outliers, PM workload distribution, projects with expiring permits or expired COIs, attention-queue trends over time. The morning question of what should I worry about today has a one-screen answer.
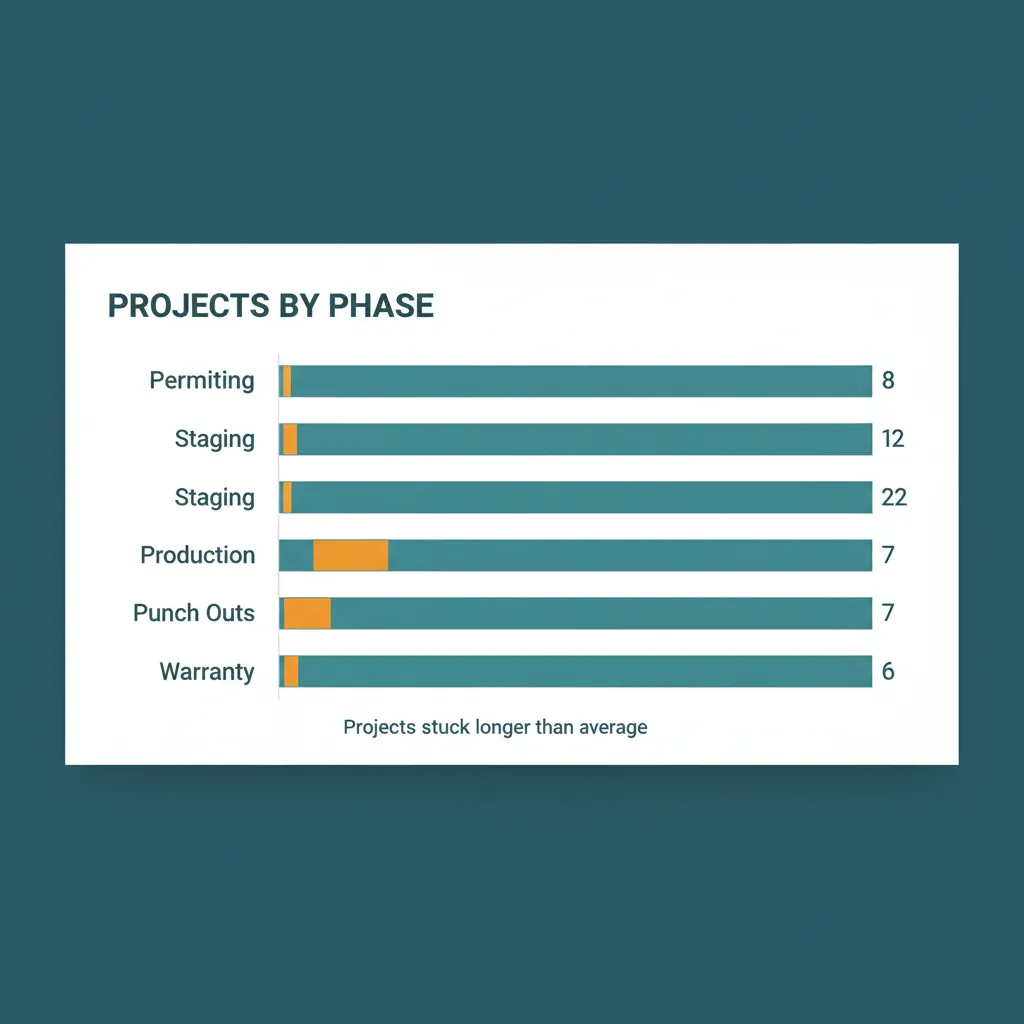
Counts per phase. Outliers in amber. Worry shows up before the customer call does.
Sales Reports
Pipeline by source, conversion rate by salesperson, average quote value by month, win-loss reasons, lead-to-close time. Connects directly to the CRM data. Owners stop relying on monthly sales meetings to find out who is actually closing.
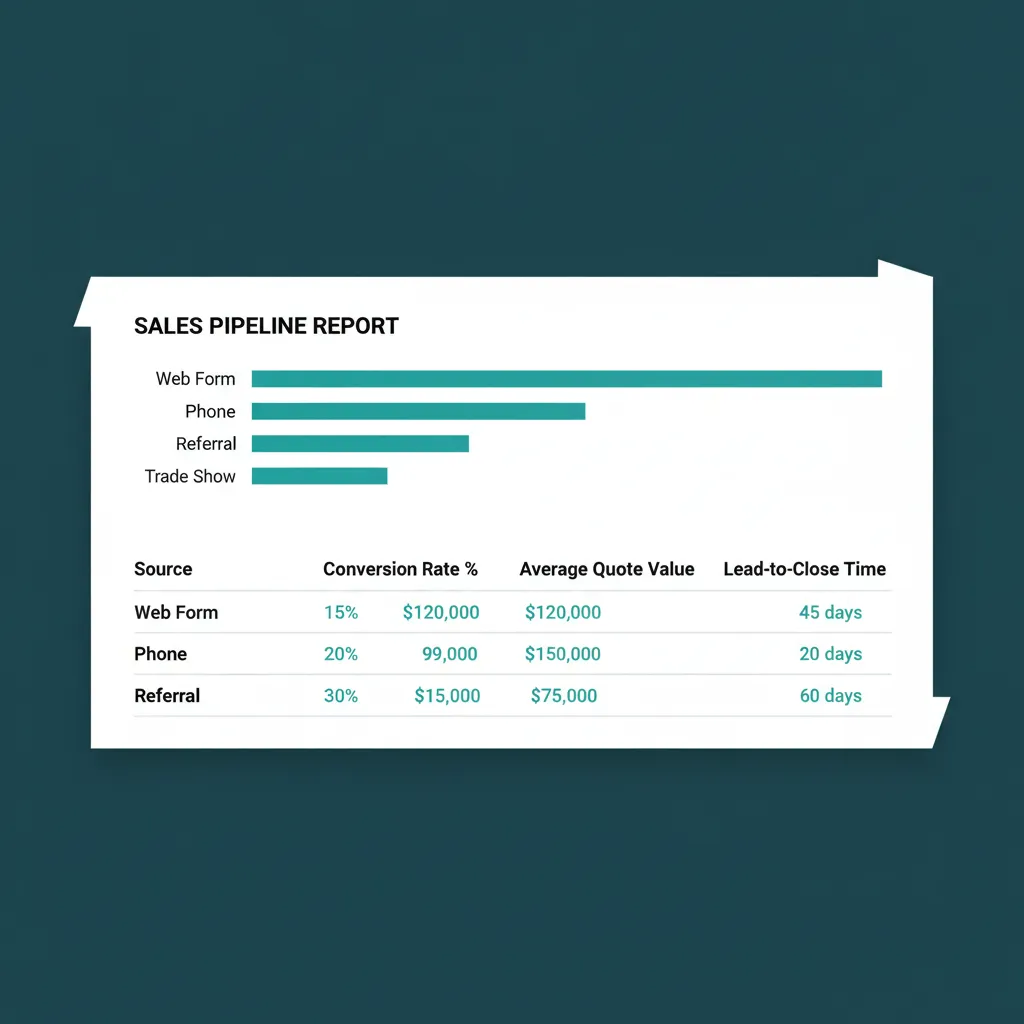
Pipeline by source. Conversion by rep. Win and loss reasons in one row each.
Employee Activity Reports
Per-employee breakdown of work orders started, completed, and edited. Time entries by PM and by project. Audit trail of who changed what when. Not surveillance, accountability. Employee activity reports construction owners can actually use, with the same data visible to the employee on their dashboard.
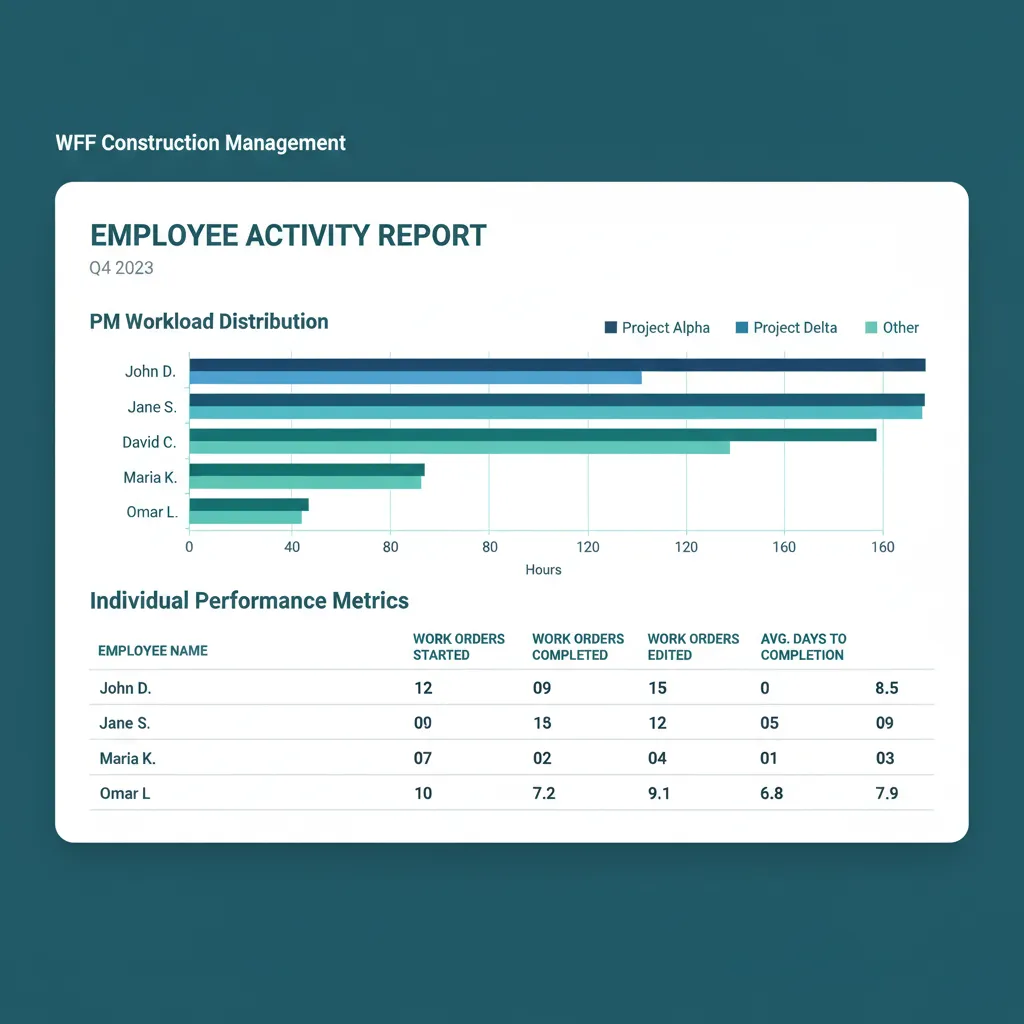
Work orders started, completed, edited. The PM sees their own row, not just the boss.
Custom Filters and Export
Every report supports filters across project type, time range, PM, phase, sales source, and customer. Export to Excel or PDF for board meetings or lender reviews when raw exports are still required. Live first, exportable second.
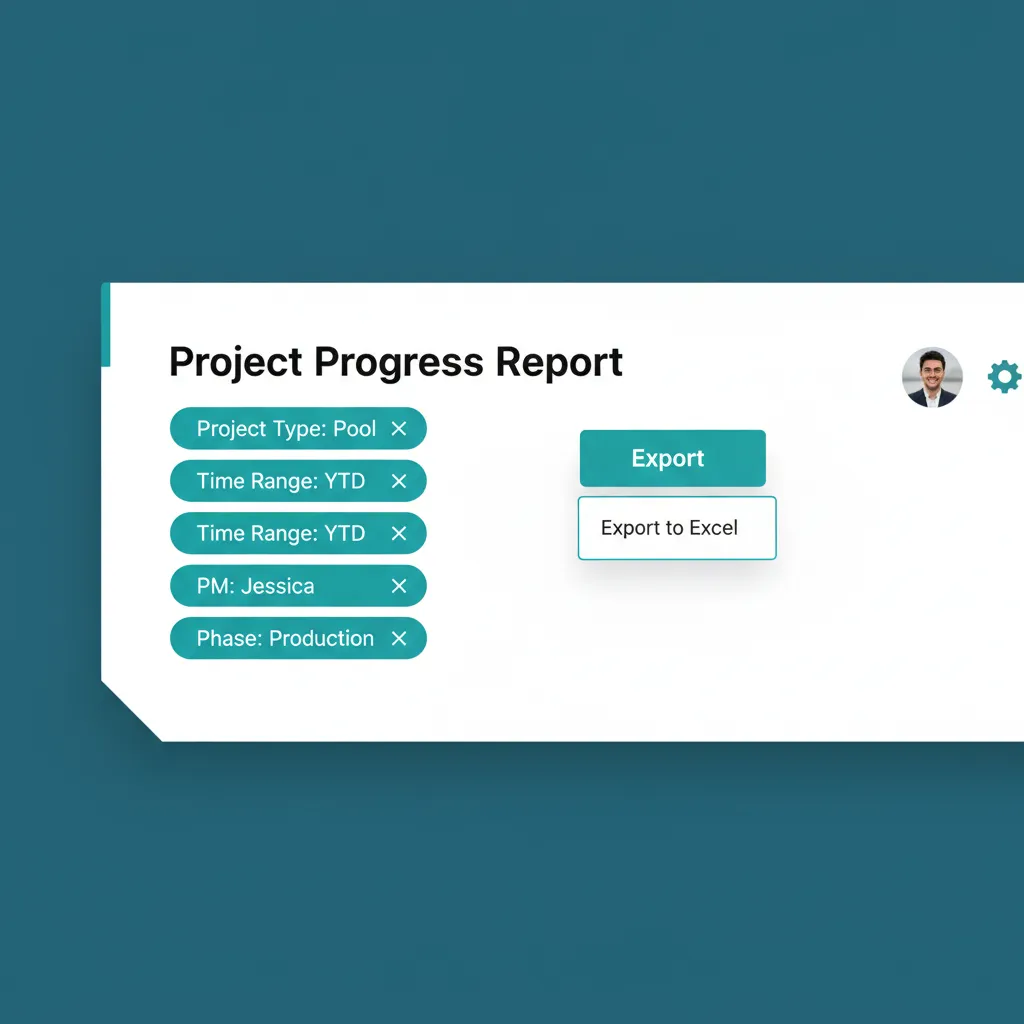
Pool. YTD. Jessica. Production. Filter pills stack. Export when the bank asks.
WHAT GENERIC REPORTING CANNOT DO
A Report Is Not a Spreadsheet.
Most construction tools treat reporting as a feature that exists to satisfy the do-you-have-reporting sales-call question. The export button is there. The customizable dashboard is not. The data is offered raw, with the implicit expectation that someone in your office will build the actual report in Excel.
WFP starts from the question, not the data. Owners ask which projects are profitable and the dashboard answers. Owners ask which PMs are behind and the dashboard answers. The data structure is built around the questions, which is why the reports update live, not on Tuesday morning. Construction business intelligence at this level is the difference between two-hour production meetings and 30-minute ones, because everyone walks in with the same picture.
Why we built this
Built around the questions construction owners ask. Not the columns Excel can pivot.
ONE COMMON LANGUAGE
Production meetings collapsed from two hours to thirty minutes.
Production meetings that used to take hours became fast and focused because everyone arrived with a common language. The owner, the PMs, and the sales lead opened the same dashboard. The conversation moved from what are the numbers to what are we doing about them.
Common Questions About WFP Reporting
Financial reports (profitability, AR aging, cash flow, draw status), project reports (active projects by phase, duration outliers, attention-queue trends), sales reports (pipeline by source, conversion by salesperson, win-loss reasons), and employee activity reports (work orders started or completed, time by project, audit trail). Every report is a live dashboard, filterable across project type, PM, phase, time range, and source.
Yes. Every report supports export to Excel or PDF. Most operators stop using the export button after the first month because the live dashboard answers the question faster than any spreadsheet, but exports are still useful for board meetings and lender reviews.
Yes. Per-employee breakdowns show work orders started, completed, and edited; time entries by PM and project; and an audit trail of who changed what when. The framing is accountability, not surveillance. The data is visible to the employee on their own dashboard, not just to the owner.
Live. When a draw is collected, when a work order is completed, when a quote is sent, the dashboard reflects it in real time. No nightly batch jobs. No the-data-is-from-yesterday caveat.
Yes. The KPI cards at the top of the dashboard are configurable per user. The owner sees cash collected and YTD profitability. The PM sees attention queue and active project count. The sales lead sees pipeline value and close rate. Each user gets the dashboard their role actually uses.
Yes. Configurable project types are supported across every report. Pool builders running a mixed operation can isolate the construction reporting software view to one vertical at a time, or run side-by-side comparisons of profitability across verticals.
Related Features
Financial Management
See every dollar coming in, going out, and sitting uncollected.
Project Management
Phase-based lifecycle, automatic transitions, and an attention queue for stalled jobs.
CRM and Lead Management
Track every lead from web form to signed contract. Owners see every quote.
See WFP Reporting in Action.
Bring three real questions you ask about your business every month to a demo. We will show you how the dashboard answers them in 60 seconds, not three hours.
Schedule a DemoNo 6-month onboarding commitment. No per-seat pricing. Just a conversation about how your operation could run.